Einstein Continued: Real Equations

It is very, very exciting to have real equations on a blog! Previous bloggers relied on latex code without a decoder. Certain bloggers don't offer anything new except for snipes at each other. This site will strive to be both scientifically and technologically ahead.
Here, with acknowledgements to the supernova groups, is the updated Type Ia graph. Low redshifts increase linearly, indicating that the Universe expands and slows as Einstein-de Sitter predicted. Higher redshifts appear to curve upward, leading to speculation about repulsive energies. In fact, the data shows that c has decreased in exactly the amounts predicted.
Start with the expressions for c and R:

An object of redshift Z = 1.0 recedes at 60% of the present speed of light. That is only 42% of c at the time that light was emitted. The apparent z we measure is z = 0.57. For an absolute Z = 0.5, apparent z = 0.38 (horizontal arrows).
According to that other Einstein equation, energy output is also affected by change in c. For a supernova of Z = 1.0, energy output is doubled for a magnitude change of -2.5log(2) = -.75. For a supernova of Z = 0.5, magnitude change is -2.5log(1.5) = -.44 (vertical arrows).
Please observe the thick black prediction line. The line is difficult to see in the larger graph, because it is covered in data points. When the graph is blown up bigger, within error bars the prediction intercepts more than 90% of the points. Prediction fits the data precisely, without invisible energies.
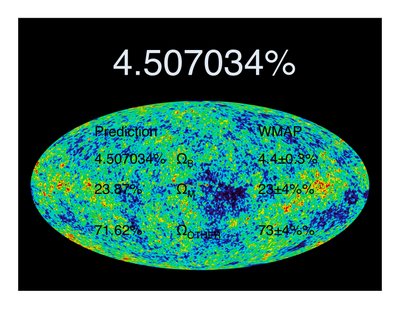
It is possible to believe that a "dark energy" fills space and pushes the graph upward. Those of you with functional minds and critical thinking skills, which do you find reasonable? Hint: for some reason, others don't want you to see what is reasonable. The alternative to Theory is no theory at all, just an inferred fudge factor.
As you read this, more people are being exposed to real Theory with real equations. As was said in my very first posting, science is an adventure I am happy to be part of.


